Main Window
To open the DHDCS application window, follow these steps:
- Alternatively, with an open Toolbox or SX2 config with minimum version 9.1 or higher, press
F7key. - Alternatively, DHDCS.exe can be started manually.
DHDCS Icon (Orange) in Windows Taskbar
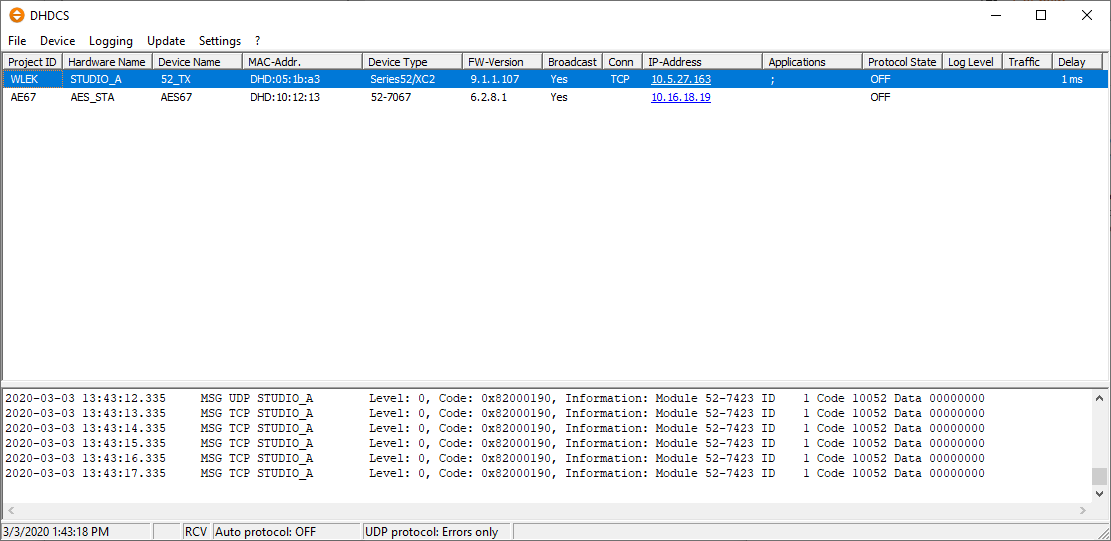
The application window consists of the following main parts (top to bottom):
- Menu bar - there you find menus with commands that can be used to control the functions of the DHDCS.
- Device list - shows all devices, that are visible in the network. The devices in the list have registered automatically using UDP broadcast messages. Also manually added devices will be shown. The listed details for each device are explained in the next section. (see also Add Device)
- Logging area - shows all messages that are transferred from the devices to the DHD Communication Server. The data can be transferred via the serial port or via Ethernet using the TCP/IP or UDP protocols. You can filter the shown messages by setting the logging options

DHDCS Main Window
Tip
You can change the size of the device list and the logging area by moving the split bar between them. When the pointer becomes a double-headed arrow, drag the pointer to move the split bar.
- Status bar - shows the current date and time, status of the Auto Protocol and how messages are filtered in the logging area.
Device List
The device list lists all devices discovered in your network or added manually.
Tip
Click the IP-address in a list entry to open your systems default browser application and automatically connect to the Device's Web Apps.
Please see our list of recommended browsers.
The list is divided in columns showing the following information for each device.
| column | description |
| Project ID | This is a four-digit project ID of the device, which is broadcast by the device. |
| Hardware Name | Shows the Hardware Name which can be set in the device's Network Configuration |
| Device Name | These are the first ten characters of the device name as broadcast from the device. |
| MAC-Addr. | Shows the MAC address of the device. If the device was not automatically registered via the UDP protocol, this information is not available. |
| Device Type | Shows the type of the device. |
| FW-Version | Shows the current firmware version of the device. |
| Broadcast | The value Yes means that the device is broadcasting UDP messages. If this column is empty, there is no UDP connection possible at the time. |
| Conn | Here, the kind of data connection is indicated. COM means that the device is connected to the PC via a serial port. TCP means that there is a direct connection using the TCP/IP protocol. |
| IP-Address | Shows the IP address of the device. Click to open web interface of the device. |
| Applications | This column shows, which DHD applications are connected to the corresponding device. |
| Protocol State | This column indicates whether the logging for the device is active (ON) or not active (OFF). The additional information ON (by <Client>) indicates that the data connection was started by a DHD application. If the value ON is displayed, there is always a direct TCP/IP-connection or a serial connection. |
| Log Level | Shows the currently set Log Level for this device, default value is 0. Log Level 0 logs only the most critical system events like reboots or I/O box reconnections. Log Level 6 provides additional detailed data about events like pressing a button, fader movements or control data sent from automation systems. To change the Log Level, right-click on the selected device. In the contextual menu you can select the Log Level. |
| Traffic | Shows high if the broadcast traffic from the device is high. |
| Delay | Measure the current Round Trip Time (RTT). This equals running a Ping command in a standard terminal application. Delay time is only shown and measured for devices with active TCP connection (e.g. selected entry in the list, active logging, manually added devices) |