View Menu
Maintenance
Using this command, you open the DHDCS. In this window, you have direct access to the modules of DHD systems, important settings and services. These functions are of a great variety and are therefore dealt within an own chapter. See DHDCS.
You can also open DHDCS by pressing F7.
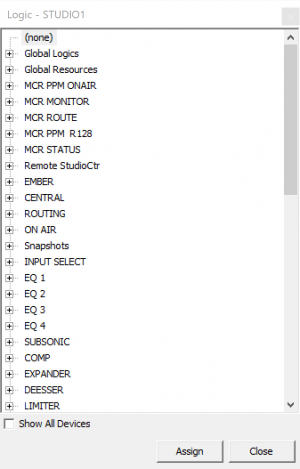
Logic Sources
This window shows all internal logic signals that are available for configuring the selected device. The corresponding device must be selected in the project tree. The logic sources are grouped according to their characteristics.
If you use this window to select logic sources as inputs for Global Logics, the logic sources of all devices in the current project are shown.
You can also open this window by pressing F5.
Audio Sources
This window shows all internal audio signals that are available for configuring the selected device. The corresponding device must be selected in the project tree. The audio signals are grouped according to their characteristics.
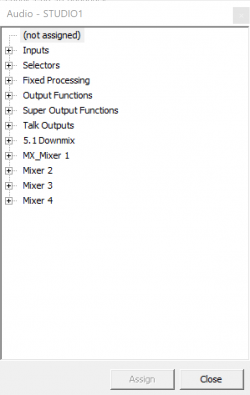
On the internal TDM bus, the following audio channels are available: inputs, delays, mixing functions (sums, groups, Aux busses) pre-fader signals (fader channel after input processing), clean feeds (n-1 busses), monitor functions, fixed processing, output functions, super output functions, talk outputs and 5.1 Downmix.
You can also open this window by pressing F6.
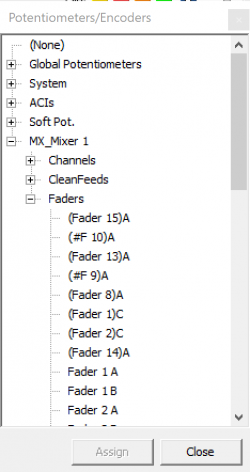
Potentiometer / Encoder sources
This window shows all Potentiometer / Encoder Sources that are available for assigning a potentiometer/fader to the selected potentiometer function.
You can open this window by pressing F9
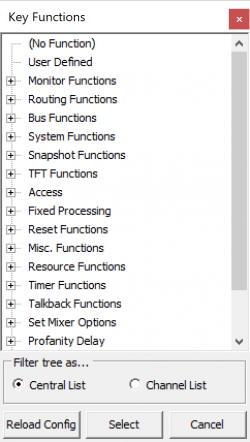
Key Functions
This window shows all Key Functions that are available for configuring the keys of the selected device. The corresponding device must be selected in the project tree, as well as a key under <Device>/<Mixer>/Console or <Device>/<Mixer>/Additional Modules. The logic sources are divided into groups according to their characteristics.
You can open or enable the window also by pressing F8.
Watches - Logic Monitor
With the Logic View window you can monitor all logics of the currently loaded Toolbox project.
For clearness, you can create several views including logics. Click ![]() to generate a new view,
to generate a new view, ![]() deletes a view and with
deletes a view and with ![]() you can rename it. All views are available in the
you can rename it. All views are available in the Logic Monitor Set list.
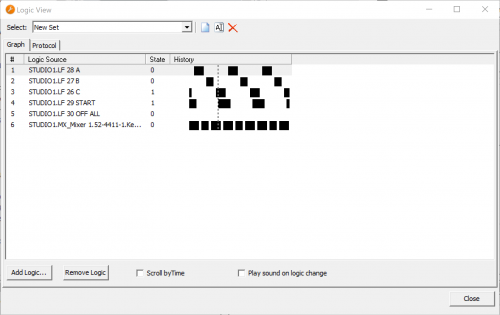
The Graph tab shows all logics in a time line. Click Add Logic to open the Logic Sources window and to add a new logic to the view. Remove Logic deletes the selected logic from the list. On the left hand side of the window you can find the labels of all inserted logics. The graphical view next to these labels shows the state of the logics at different times. The intervals of the on/off periods are not related to the time, but to each other. All labels with a grey background are currently active.
If you select the Scroll by Time check box, the history is not shown and you will only see, which logics are currently active. Moreover, it is possible to clear the history and to activate a sound that signalises the change of logic states.
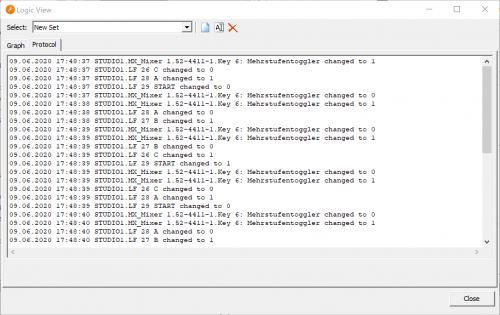
Instead of the graphical view, you can choose the Protocol tab. Here, you can find the changes of the logic states and the absolute time the changes did occur.
Global Logic Monitor
Global logics are used for exchanging logic signals between different devices. This is done by using UDP commands via the Ethernet port. By the help of the Global Logic Monitor window, you can check whether the signalling between the different devices works as intended.
Important
For the monitoring, the hardware must be available on the network. Further on, the Toolbox PC must be in the same IP network segment (Subnet) to receive and send UDP commands. Finally, in the Toolbox software, a project file must be loaded which Project ID is identical with the one of the system that is monitored.
Note
The functions of the Global Logic Monitor window do not affect an open project file. If you only want to use the Global Logic Monitor of the Toolbox software, you only have to open the project file to define the Project ID of the monitored system. Alternatively, you can also create an empty project and enter its ID manually on the Project Options tab.
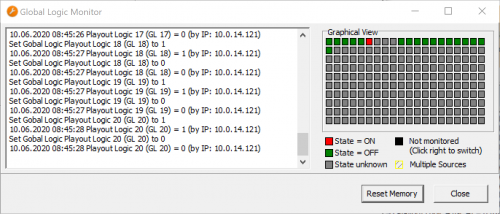
The Global Logic Monitor window shows all results as text as well as a chart. On the left side, the events are listed with time, name, transferred condition (logic 1 or 0) and the IP address of the sender. On the right, in the Graphical View area, there are 10 lines and 20 columns of a total of 200 small boxes. Each box indicates the logic condition of one of the 200 available global logics.
Tip
If you move the cursor over one of the boxes and leave it there for a second, a tool tip shows the number of the corresponding global logic function.
In the Graphical View area, you can also set the logic conditions. To do this, click once or twice in the box of the selected function to set the desired value. As a feedback, the box changes its color and the result is shown in the list.
The colors of the box indicate the condition of the corresponding logic function and have the following meaning (you also find these explanations in the Global Logic Monitor window below the Graphical View area):
- Red,
State = ON: The logic function has the condition logic 1. - Green,
State = OFF: The logic function has the condition logic 0. - Grey,
State unknown: The current condition of the logic function is not known. This is the case until a corresponding UDP command is received that sets the condition of a function. With the help of theReset Memorybutton, all currently shown conditions can be reset manually. In this case, all boxes are grey again. - Black,
Not monitored: The monitoring of the selected function is disabled. The corresponding events are not shown in the list. This function can be used if certain conditions change quite often and therefore disturb the display. Right-click in the desired box to switch this filtering on or off. - Hatched,
Multiple Sources: If the condition of a global logic function was set by more than one device, the corresponding box appears hatched.
Note
The condition of a global logic function is shown grey (state unknown), as long as it is unknown. This changes as soon as an UDP message arrives that communicates the state of the function. Every second, the condition of one global logic function is transmitted to all devices in the project. This way, after 200 seconds after opening the Global Logic Monitor window, the conditions of all global logic functions are transmitted once.
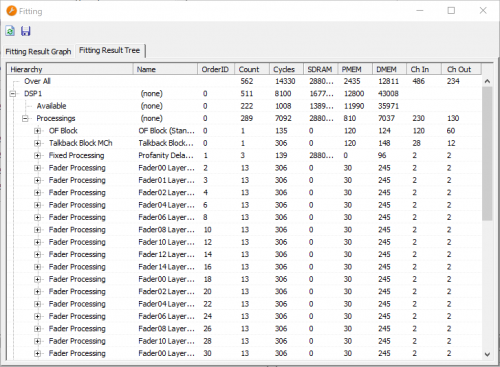
Fitting Report
The DSP load of the device selected in the project tree can be checked in the Fitting Report. This command opens a new window in which the load of the DSP resources is shown.
The command is only available if a device is selected in the project tree.
On the Fitting Result Graph tab a graph shows which process (e.g., limiter or sine generator) occupies which resources in the system. For this, select the desired process in the List of processings. The corresponding sections are shown in a different color in the graph. Because the assignment of storage areas are organized dynamically, it is unpredictable which process runs in which storage area.
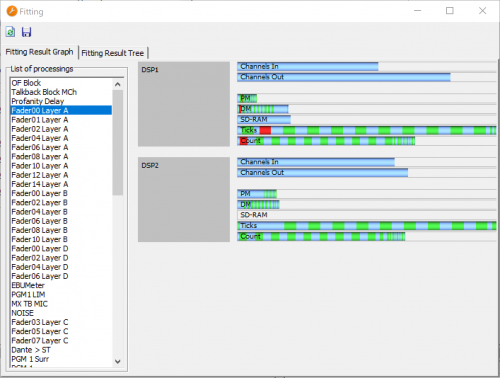
If your Config can not be transferred to a device, although the load display DSP capacity bar is not indicating a 100% load, check the Fitting Report, whether a process might have a 100% load in a storage area. In this case, the process must be modified or the functions have to be reduced.
The Fitting Result Tree tab describes the resource assignment with numeric values.
Click ![]() to update the fitting report.
to update the fitting report.
Click ![]() to save the fitting report, for example in the case of support.
to save the fitting report, for example in the case of support.
Note
The structure of the DSP load is very complex. Please ask the DHD support team if you need to read out further detailed information from the fitting report.
Available Audio/Logic IDs
The content of the Audio and Logic IDs View window is useful if you want third party devices to communicate with the DHD system by an external protocol. Because the audio and logic IDs are assigned dynamically in Toolbox, it is necessary to take a look at this list.
Project as XML Tree
This function shows the configured data of the Toolbox project as XML code. It is especially of interest to developers of third party software applications and hardware that should deal with the configured data of the Toolbox project.